Aptitude Questions on Data Interpretation
Topic-wise Aptitude Questions
Q. 1 The table below shows the number of employees in five different departments over three years. Answer the following question:
| Department | 2021 | 2022 | 2023 |
| HR | 120 | 135 | 150 |
| Sales | 200 | 180 | 190 |
| IT | 250 | 260 | 270 |
| Marketing | 150 | 140 | 145 |
| Finance | 100 | 110 | 120 |
What is the percentage increase in the total number of employees from 2021 to 2023?
(a) 10%
(b) 15%
(c) 6.71%
(d) 14%
Check Solution
Ans: (c) 6.71%
Find the percentage increase:
$\text{Percentage Increase} = \frac{\text{875} – \text{820}}{\text{820}} \times 100 = \frac{55}{820} \times 100 \approx 6.71\%$
Q. 2 A company’s annual budget is distributed across five departments:
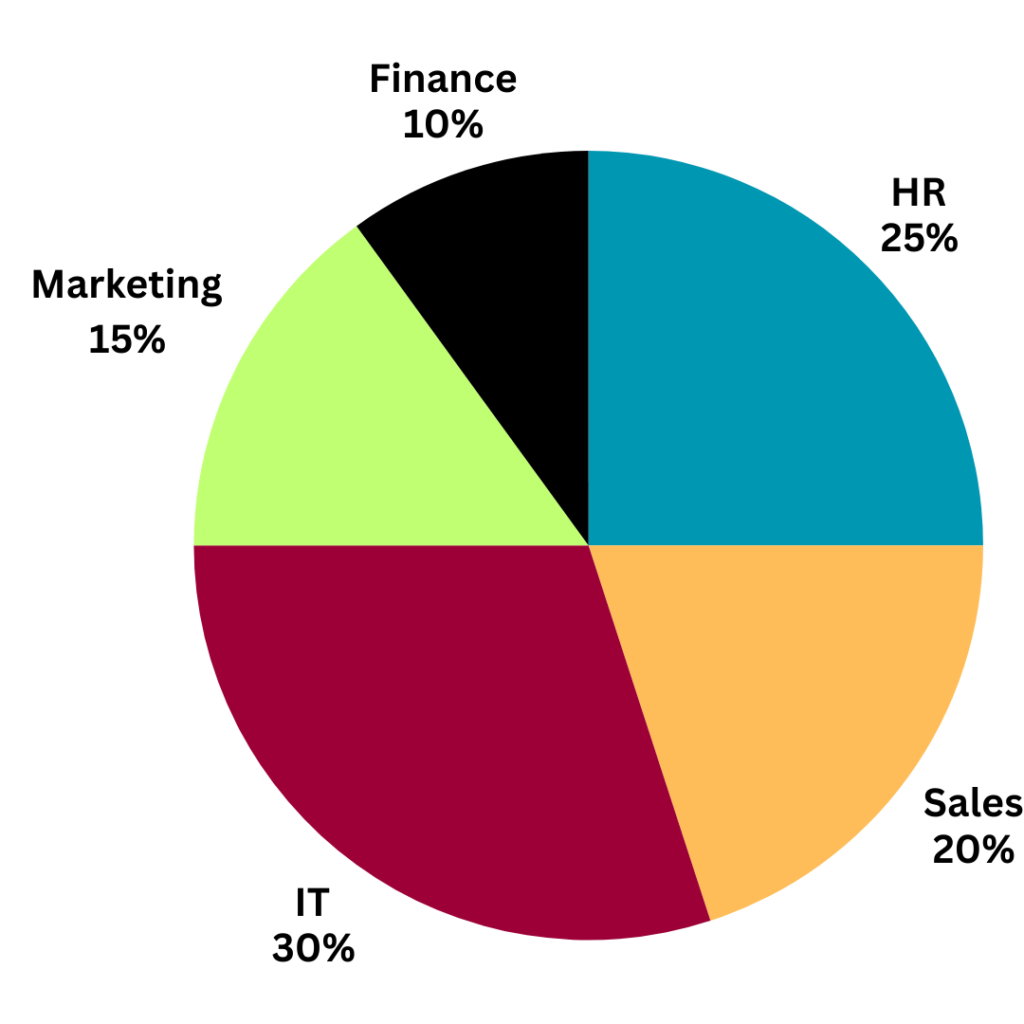
The total budget is $2,000,000. What is the budget allocated to the Marketing department?
(a) 200,000
(b) 300,000
(c) 150,000
(d) 250,000
Check Solution
Ans: (b) $300,000
Step 1: Marketing’s percentage share is 15%.
Step 2: Total budget = 2,000,000.
Marketing budget = $15\% \times 2,000,000 = 300,000$
Q. 3 The bar graph below shows the production (in tons) of three crops: Wheat, Rice, and Maize over four years.
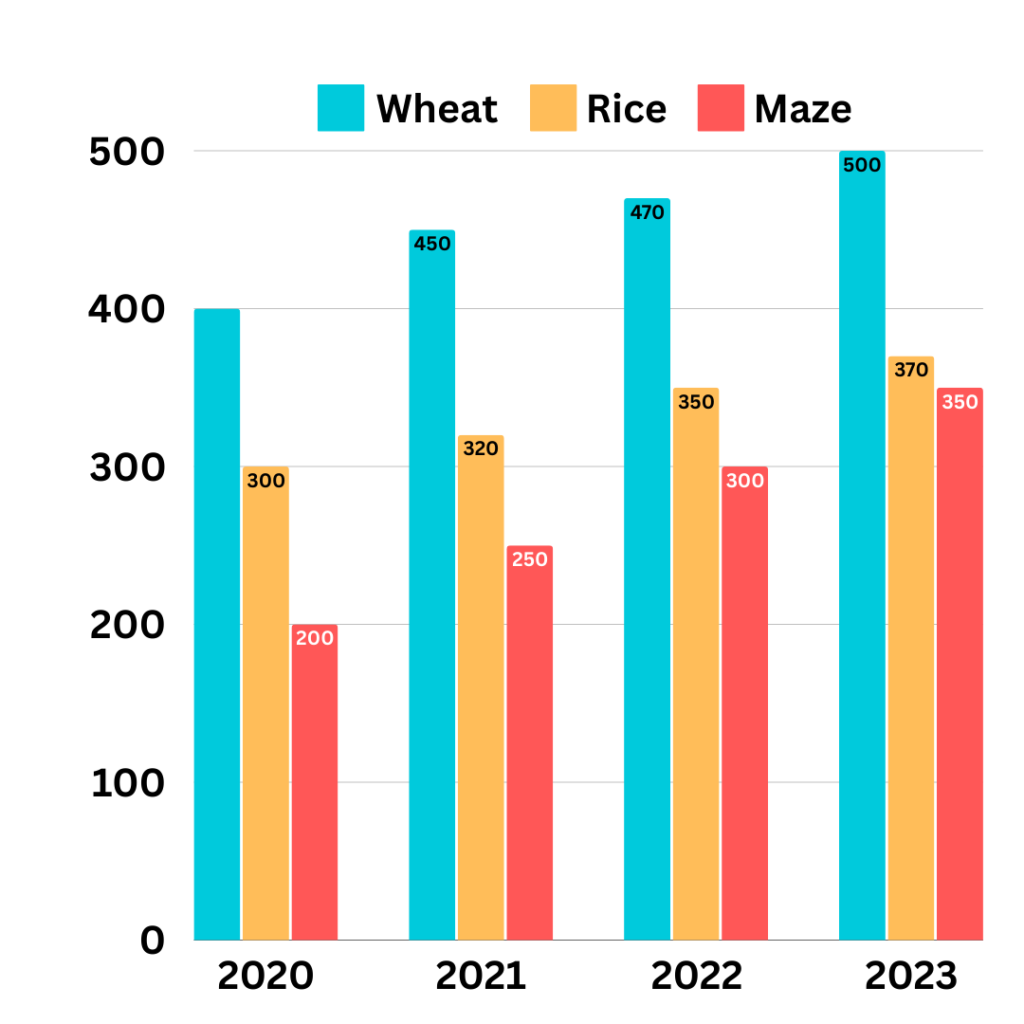
What is the average production of Maize over the four years?
(a) 275 tons
(b) 300 tons
(c) 325 tons
(d) 250 tons
Check Solution
Ans: (a) 275 tons
Step 1: Add up the total production of Maize over the years.
- Maize production: 200+250+300+350=1100
Step 2: Calculate the average:
$\text{Average Production} = \frac{\text{Total Production}}{\text{Number of Years}} = \frac{1100}{4} = 275$
Q. 4 A company’s quarterly profits (in $1000) for the years 2022 and 2023 are as follows:
| Quarter | Q1 | Q2 | Q3 | Q4 |
| 2022 Profit | 25 | 30 | 35 | 40 |
| 2023 Profit | 30 | 35 | 40 | 45 |
What is the percentage increase in total annual profit from 2022 to 2023?
(a) 10%
(b) 15%
(c) 20%
(d) 25%
Check Solution
Ans: (b) 15%
Step 1: Calculate the total annual profits for 2022 and 2023.
- 2022: 25+30+35+40=130
- 2023: 30+35+40+45=150
Step 2: Find the percentage increase:
$\text{Percentage Increase} = \frac{\text{150} – \text{130}}{\text{130}} \times 100 = \frac{20}{130} \times 100 = 15.38\%$
Q. 5 A retail chain operates in five cities and records monthly sales (in $1000):
| City | January | February | March |
| City A | 120 | 130 | 140 |
| City B | 150 | 160 | 170 |
| City C | 100 | 110 | 120 |
| City D | 90 | 85 | 95 |
| City E | 80 | 75 | 85 |
What is the total sales in March across all cities?
(a) $610,000
(b) $640,000
(c) $650,000
(d) $600,000
Check Solution
Ans: (a) $610,000
Step 1: Add the sales for all cities in March:
- 140+170+120+95+85=610 (in $1000)
Step 2: Convert to dollars: $610 \times 1000 = 610,000$
Q. 6 The table below shows the cost of raw materials (in $) for three companies over four years.
| Year | Company X | Company Y | Company Z |
| 2020 | 1500 | 1400 | 1300 |
| 2021 | 1600 | 1500 | 1400 |
| 2022 | 1650 | 1550 | 1450 |
| 2023 | 1700 | 1600 | 1500 |
Which company had the highest percentage increase in raw material costs from 2020 to 2023?
(a) Company X
(b) Company Y
(c) Company Z
(d) All had the same increase
Check Solution
Ans: (c) Company Z
Step 1: Calculate percentage increases for each company:
- Company X: $\frac{1700 – 1500}{1500} \times 100 = \frac{200}{1500} \times 100 = 13.33\%$
- Company Y: $\frac{1600 – 1400}{1400} \times 100 = \frac{200}{1400} \times 100 = 14.29\%$
- Company Z: $\frac{1500 – 1300}{1300} \times 100 = \frac{200}{1300} \times 100 = 15.38\%$
Step 2: Compare the increases.
Company Z has the highest increase.
Q. 7 A company’s yearly revenue (in $million) over five years is shown below:
| Year | Revenue |
| 2018 | 50 |
| 2019 | 55 |
| 2020 | 60 |
| 2021 | 70 |
| 2022 | 80 |
What is the cumulative revenue from 2018 to 2022?
(a) 305 million
(b) 315 million
(c) 320 million
(d) 300 million
Check Solution
Ans: (b) $315 million.
Step 1: Add up the revenues: $50 + 55 + 60 + 70 + 80 = 315 \text{ million dollars.}$
Q. 8 The data below shows the distribution of ages in a community:
0–10 years: 100
11–20 years: 200
21–30 years: 150
31–40 years: 250
Above 40 years: 300
What percentage of the population is aged 31 years or above?
(a) 60%
(b) 55%
(c) 70%
(d) 75%
Check Solution
Ans: (b) 55%
Step 1: Add the population aged 31 or above:
- 250+300=550. Total population = 100+200+150+250+300=1000
Step 2: Calculate the percentage:
$\text{Percentage} = \frac{550}{1000} \times 100 = 55\%$
Q. 9 A company’s sales data for different products over a quarter (in units) is as follows:
| Product | January | February | March |
| A | 500 | 520 | 540 |
| B | 300 | 320 | 310 |
| C | 400 | 410 | 430 |
What is the total sale of Product C during the quarter?
(a) 1240
(b) 1260
(c) 1280
(d) 1300
Check Solution
Ans: (a) 1240
Step 1: Add the sales of Product C across the quarter:
400+410+430=1240.
Refer Questions for next topic: https://www.learntheta.com/aptitude-questions-alpha-numeric-series/
Refer Thousands of Aptitude Questions with Answers and Detailed Solutions
LearnTheta is an AI-powered practice platform designed to help students to crack Placement Aptitude Tests: https://app.learntheta.com/signup
Practice Data Interpretation with real-world problems:
1. Netflix Preference Math Problem
2. Marvel’s Rotten Tomatoes Ratings
3. Hulu Netflix Disney Math Problem
4. BTS Math Challenge!